

Driven By Excellence

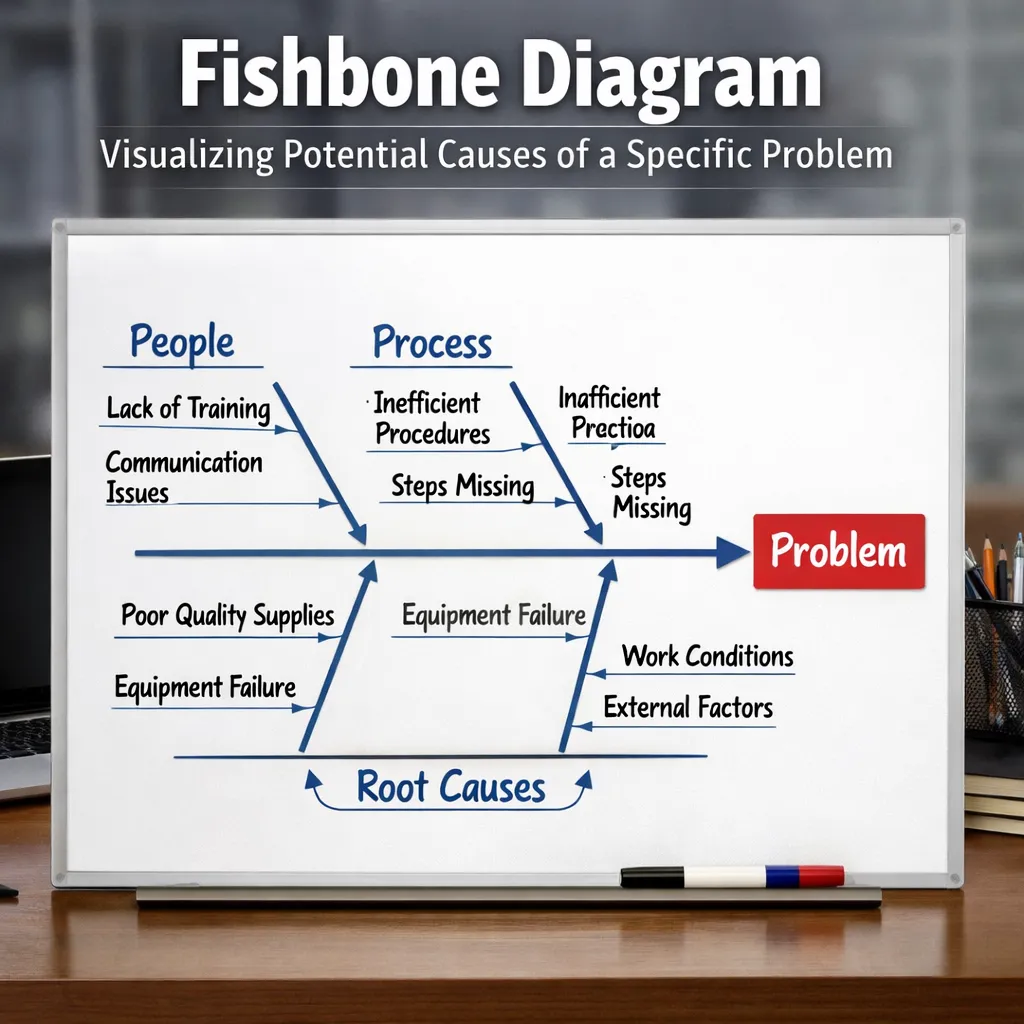
Fishbone Diagram: Visualizing potential causes of a specific problem
 by: J&P GlobalPublished on: 26/01/2026
Most businesses try to fix issues fast — slow delivery, high defects, customer complaints, rising costs… But here’s the truth no one wants to admit: You can’t fix what you don’t truly understand. And most organizations are solving the symptom, not the root cause. That is why leading companies rely on a powerful tool: The Fishbone Diagram — a simple, visual method that reveals what’s really going wrong beneath the surface.
Fishbone DiagramOperational Excellence

Copyright © 2025 J&P Global